Excel 2016 Waterfall Chart Illustrates Financial Statements
|
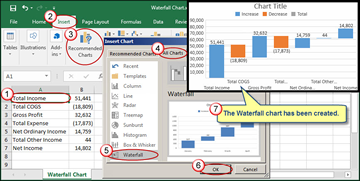
It’s often difficult to get the measure of an income statement by simply glancing at it. Numbers quickly blur together, and there’s often very little frame of reference of how the numbers flow from Total Revenue down to Net Income. If you’re using Excel 2016 you now have a new way to visualize financial statements. The upside is these charts are easy to create—as long as you’re aware of a nuance—but the downside is that these charts can’t be shared with anyone using Excel 2013 or earlier. To create a waterfall chart you must first create a summary version of your income statement which should only include major totals or subtotals. |
 |
Download a sample Excel file. Requires Excel 2016.
Â
|
|
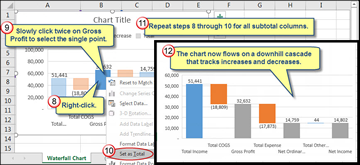
Next, as illustrated:
|
|
Â
Download a sample Excel file. Requires Excel 2016.
Â
